In the 23March2018 post titled "Use of Power Guide Curve Rule in HEC-ResSim", the behavior of the plant factor relationship with the percentage of power storage in use was examined. This was done by varying the plant factor based on the percentage of power storage in use and having power generated at each time step.
In this post, the plant factor will be set to 100% for all values of percentage of power storage in use and the behavior of the power generation pattern will be examined. Varying amounts of power generation will be required based on time of day.
Below is a review of the details of this model.


In this post, the plant factor will be set to 100% for all values of percentage of power storage in use and the behavior of the power generation pattern will be examined. Varying amounts of power generation will be required based on time of day.
Below is a review of the details of this model.
In this post, I have developed a simple reservoir network with one
reservoir. The schematic is shown below.
This reservoir has a powerplant with the following
characteristics:
Hydraulic capacity = 500 cfs
Installed capacity = 2 MW
Efficiency is a constant 80%
Constant tailwater of 25 ft
The installed capacity tab of the power plant is shown below.
The following top of zone elevations are
used in the operations set. They are constant throughout the entire
year.
Top of flood = 100 ft
Top of conservation = 75 ft
Top of inactive = 50 ft
These are shown in the figure below.
The plant factor is set to 100% for all values of the percent of power storage in use as shown below.
In this example, the power generation pattern is either set to 0, 0.5, or 1.0. This means that the power generation will either be zero, one-half of the capacity, or full capacity. To set the power pattern, select the Power Generation Pattern button and input the values. For this example, the power generation pattern is the same for each day, but it can vary by season, by day of week, or by whether the day is a weekday or a weekend day.
The following generation takes place each day:
- 00:00 to 05:00 = no generation
- 05:00 to 09:00 = generation at half capacity
- 09:00 to 12:00 = no generation
- 12:00 to 16:00 = generation at full capacity
- 16:00 to 19:00 = no generation
- 19:00 to 21:00 = generation at half capacity
- 21:00 to 24:00 = no generation
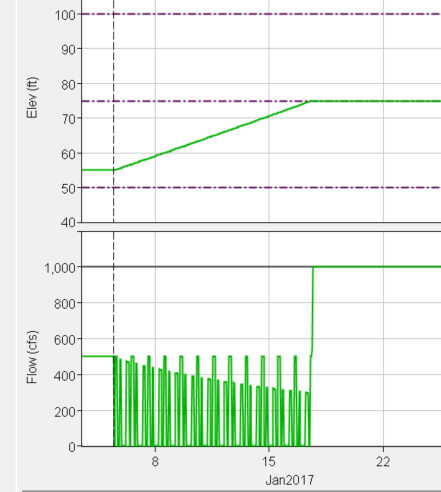
In the top plot in the figure below, it is seen that the pool begins in the conservation zone and rises throughout the simulation period until it reaches the top of conservation at elevation 75.0 feet.
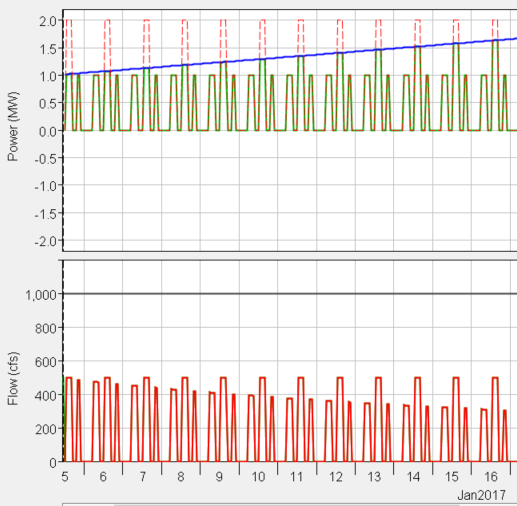
The figure below shows the power operations. In the top plot, you can see the periods of half generation taking place in the morning and the evening with the full generation taking place mid-day. The half generation requirement is met since the requirement (red dashed line) is below the capability (solid blue line). The full generation requirement is not met since the requirement (red dashed line) is above the capability (solid blue line). This causes the actual generation (green line) to be cut off at the capability line when full generation is required.
With the rising pool elevation, the head differential is increasing. This leads to lower flow being required to meet the power demands when half generation is required. This is the reason for the decreasing flows seen in the bottom plot of the figure below. Note that the full generation flows are not impacted since the maximum hydraulic capacity is being used to try to meet the 2 MW requirement.
Comments
Post a Comment