This blog post details a study that I performed several years ago using HEC-ResSim. I presented the results of this analysis at the 2011 U.S. Society on Dams Annual Conference.
This analysis was necessary since two of the six spillway gates at this project had the potential to become inoperable. If this were to occur, an alternative reservoir operating plan would be needed.

The reservoir has the following pools:


This analysis was necessary since two of the six spillway gates at this project had the potential to become inoperable. If this were to occur, an alternative reservoir operating plan would be needed.

The reservoir has the following pools:
- Inactive Pool
- Conservation Pool
- Flood Pool
- Surcharge Pool
The top of the flood pool corresponds to the top of the spillway gates in their closed position. Once the pool level is projected to exceed to the top of the flood pool, the spillway gates are opened creating a surcharge operation. However, if two gates are stuck in the down position, the surcharge operation is impacted by flow going over the top of the two gates stuck in the down position.

At this project, a family of curves is used to determine the surcharge operation. As can be seen in the figure below, the release increases much more significantly with pool elevation changes at the higher elevations (shown by the flattening of the curves). As one would expect, releases are greater for high inflows. These curves define the minimum release value for a given combination of pool elevation and inflow.

To develop the alternative operating plan, I analyzed several combinations of a reduced top of conservation level along with alterations to the surcharge curves. The alterations lead to a more aggressive release at a given pool elevation. The curve below shows the original surcharge envelope curve and the revised envelope curve. For the revised curve, the original curve is dropped down 1 foot. However, it should also be noted that it is shifted over to the right due to the values being increased by 35%. The original minimum required release at elevation 636.0 feet is approximately 25,000 cfs while the revised minimum required release is closer to 40,000 cfs.

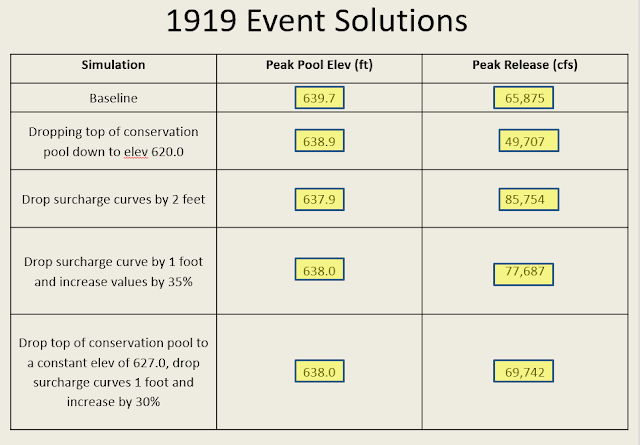
I studied historical and synthetic events for this study. The figure below shows a comparison of results from various alternatives applied to the 1919 inflow event. Peak pool elevations and peak releases are shown.
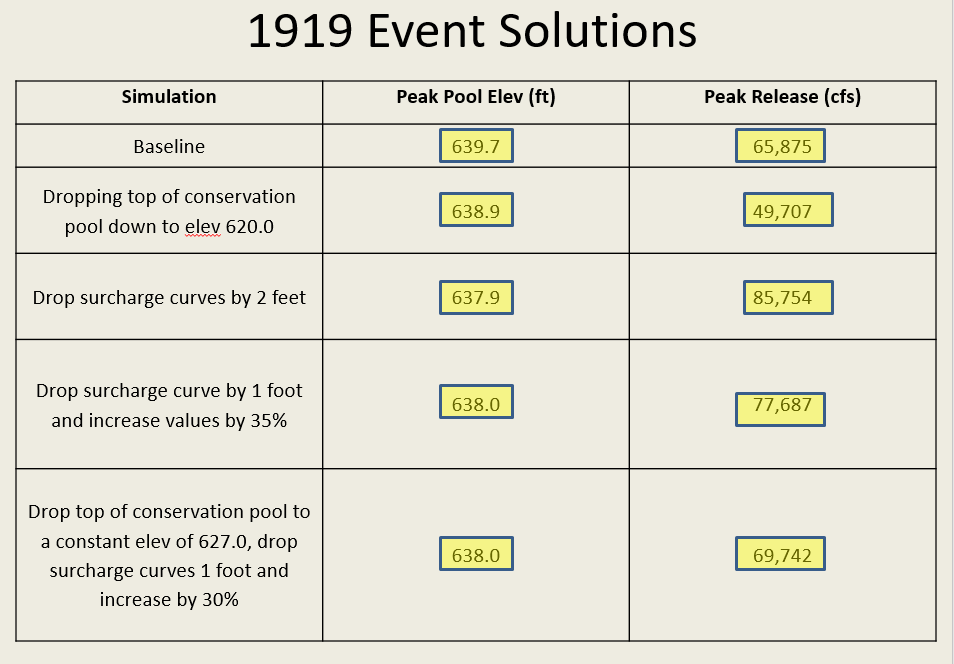
For this study, there were numerous alternatives that would satisfy the desired parameters, however, some were discarded based on their impacts. For example, in the table above, one alternative involves dropping the top of conservation down to elevation 620.0 feet. This alternative was not desirable since it left this project with no conservation storage.
Comments
Post a Comment