This post demonstrates the use of release overrides in HEC-ResSim. In this example, there is a reservoir on the main stem of the river and a reservoir on the tributary to the main stem. Our downstream control point is labeled "downstream control point".


Both reservoirs and dams are modeled with the same physical and operational characteristics. The routing reaches use null routing. There is 1,000 cfs of inflow entering the main stem and 1,000 cfs of inflow entering the tributary.
The releases from both reservoirs are controlled by the total flow at the junction, "downstream control point". The flow at this location is specified by a downstream control function rule shown below.

The rule, "ds rule", has to be applied at both reservoirs. To do this, you write the rule at one reservoir and then apply it to the other reservoir by using an existing rule.
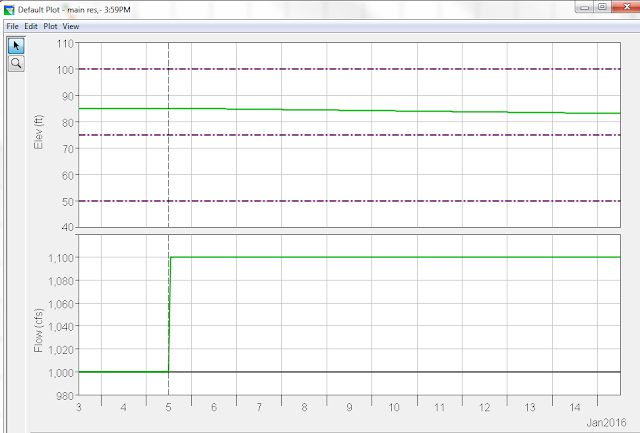
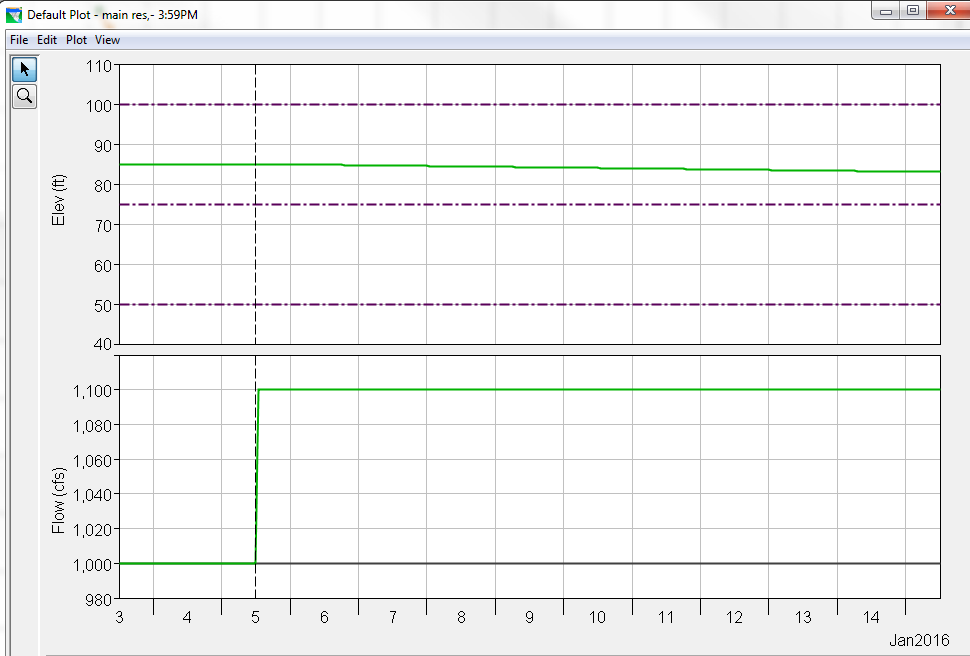
Both reservoirs start in their flood pool. Each reservoir releases 1,100 cfs (half of the downstream capacity) to remain balanced. Note that in the lookback period, each reservoir is releasing 1,000 cfs. Once the simulation begins, the release increases to 1,100 cfs. The releases are shown by the green line in the bottom plot.
Plot for main reservoir:
Plot for tributary reservoir:

The figure below shows that the total flow at the junction, "downstream control point", is limited to 2,200 cfs.

To use the release override, you would select the "Overrides" option under "Simulation". For this example, I changed the release at the main stem reservoir to 1,500 cfs for the first day. The overridden release is shown in blue.

The main stem reservoir releases 1,500 cfs for the first day and then reduces its outflow to allow more of the downstream capacity to be used by the tributary reservoir. This is done to bring both reservoirs back into balance. Note that I used the default operation in ResSim, which is to balance both reservoirs. Additionally, during the first day, the tributary reservoir releases 700 cfs to ensure that the 2,200 cfs downstream flow is not exceeded.
Plot for main reservoir:

Plot for tributary reservoir:

The plot below again shows that the downstream capacity is not violated.

Also, when looking at these plots, it should be realized that the lookback period is shown. The simulation begins on January 5 at noon. The separation between the lookback period and the simulation period is shown by the dashed vertical line.
Comments
Post a Comment