This post will detail the coding of a plant factor and a generation pattern for hydropower in ResSim.
This example was created using a simple one reservoir model.
Before I coded in the hydropower rules, I ran the model without any rules. Once the simulation begins on January 10, 2015, ResSim sets the release (green line in bottom plot) to zero since the pool is below the top of conservation (elevation 50 ft) as is shown by the green line in the top plot. The release increases to match inflow on January 14, 2015, to hold the pool at the top of conservation. This figure will aid us in seeing the impact of the hydropower rule. The internal logic of ResSim wants to hold all inflow when the pool is below top of conservation. The power rule will not allow this to happen.

The image below shows the development of the hydropower rule. The plant factor in this example is set to 100% for the entire conservation pool. It can vary with varying conservation pool levels if that is desired.

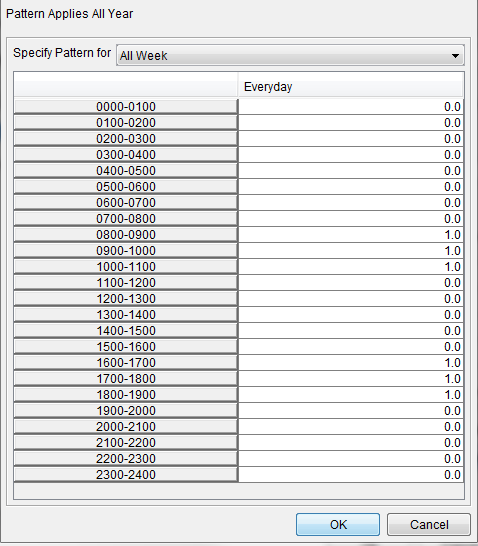
In the hydropower rule, we also want to specify a generation pattern. In the image below, I have specified two 3-hour patterns, one in the morning and one in the afternoon (shown by the 1.0 value in the second column).

Below is the result from that simulation. In this simulation, there are two defined generation periods per day. Also, notice that the pool elevation is dropping due to the power generation requirement.

In the image below, I have changed the plant factor to 50% for all conservation pool levels.

This changed the flow in the first few days of the simulation since ResSim is trying to generate 50% of the installed capacity of the power plant. With the higher pool elevation, less release is required to generate 50%. However, as the pool continues to fall, the hydraulic capacity of the plant is set to its maximum in an attempt to generation 50% of the installed capacity.

For the 50% plant factor simulation, I have also included the power plot. I have set the installed capacity to 10 MW. In the plot below (referring to the top plot for this explanation), you can see that 50% (or 5 MW) is generated on January 10 and January 11 along with a portion of January 12. After that, a declining pool elevation causes a lower head differential. With the hydraulic capacity of the power plant limited to a value of 5,000 cfs, ResSim cannot meet the 50% generation requirement. So, it releases up to the hydraulic capacity and generates as much as it can. The dashed red line is showing the desired generation while the dotted-dashed green line is showing the generating capability. You can see on January 10 and January 11 that there is the capability to generate power above 5 MW. However, beginning on January 12, the green dotted-dashed line intersects the red dashed line indicating that the generating capability has fallen below the desired generation.

One final image showing a plant factor of 20%. In this simulation, we have enough inflow to cause a rebound in the pool elevation. It can be seen that higher pool elevations lead to less release being required to achieve 20% of the installed capacity.

This example was created using a simple one reservoir model.
Before I coded in the hydropower rules, I ran the model without any rules. Once the simulation begins on January 10, 2015, ResSim sets the release (green line in bottom plot) to zero since the pool is below the top of conservation (elevation 50 ft) as is shown by the green line in the top plot. The release increases to match inflow on January 14, 2015, to hold the pool at the top of conservation. This figure will aid us in seeing the impact of the hydropower rule. The internal logic of ResSim wants to hold all inflow when the pool is below top of conservation. The power rule will not allow this to happen.

The image below shows the development of the hydropower rule. The plant factor in this example is set to 100% for the entire conservation pool. It can vary with varying conservation pool levels if that is desired.

In the hydropower rule, we also want to specify a generation pattern. In the image below, I have specified two 3-hour patterns, one in the morning and one in the afternoon (shown by the 1.0 value in the second column).
Below is the result from that simulation. In this simulation, there are two defined generation periods per day. Also, notice that the pool elevation is dropping due to the power generation requirement.

In the image below, I have changed the plant factor to 50% for all conservation pool levels.

This changed the flow in the first few days of the simulation since ResSim is trying to generate 50% of the installed capacity of the power plant. With the higher pool elevation, less release is required to generate 50%. However, as the pool continues to fall, the hydraulic capacity of the plant is set to its maximum in an attempt to generation 50% of the installed capacity.

For the 50% plant factor simulation, I have also included the power plot. I have set the installed capacity to 10 MW. In the plot below (referring to the top plot for this explanation), you can see that 50% (or 5 MW) is generated on January 10 and January 11 along with a portion of January 12. After that, a declining pool elevation causes a lower head differential. With the hydraulic capacity of the power plant limited to a value of 5,000 cfs, ResSim cannot meet the 50% generation requirement. So, it releases up to the hydraulic capacity and generates as much as it can. The dashed red line is showing the desired generation while the dotted-dashed green line is showing the generating capability. You can see on January 10 and January 11 that there is the capability to generate power above 5 MW. However, beginning on January 12, the green dotted-dashed line intersects the red dashed line indicating that the generating capability has fallen below the desired generation.

One final image showing a plant factor of 20%. In this simulation, we have enough inflow to cause a rebound in the pool elevation. It can be seen that higher pool elevations lead to less release being required to achieve 20% of the installed capacity.

In a project my Client wants the capacity of the project as 110 MW .But operating regime is such that during Rainy season (May to September) the water is to be stored even though inflow is higher and during dry season the plant should operate for at least (6hrs +6hrs) at 110 MW .The energy tariff for dry season peaking operation is lucrative.
ReplyDeleteIf I put 50% PLF then capacity itself is considered as 55MW .
Kindly suggest .
Moreover I have monthly average data from year 2000 to 2008.If I put the data in the HEC DSS , the daily data as generated is reduced .Why?
Look forward to your suggestions .
Based on your comment, I may need to develop additional posts (actually, I have started developing videos on the companion YouTube site since I believe those are preferred) about power generation and how it works. It may take me some time before I can develop these so I will try to answer your questions as best as I can here for now. If you want 110 MW, which I assume is full plant capacity, for six hours, your Plant Factor would be 100% and you would specify the generation pattern using a one for hours where you want full generation and zero for the others if you want no generation at this time. A 50% Plant Factor would reduce the generation amount to 55 MW, but it doesn't sound like that is what you wanted. For this simulation, I would run an hourly time step. For your DSS issue, I normally convert my input DSS files to the same time step that I want to use for the HEC-ResSim simulation. In reality, I don't know if that step is actually needed, but I find it to be cleaner rather than having ResSim alter the data.
Delete