This example demonstrates the modeling of pumpback in a hydropower system. For this model, there are two reservoirs. The first is the main reservoir, which contains a hydropower plant and a pump. The lower reservoir is used for storage and pumpback into the main reservoir.
The inflow into the system occurs at the upstream junction. For this simulation, a constant inflow of 1,000 cfs is used. Power is generated from the main reservoir during two time periods throughout the day. In the late night / early morning hours, water that is stored in the pumpback reservoir is pumped back up to the main reservoir. Basically, this is trying to simulate hydropower generation during peak periods and pumpback during low demand periods.
The next image shows the modeling of the pump at the main reservoir. Notice that there is a minimum tailwater of 20 feet and a maximum head differential of 200 ft. This specifies the limits of the pump's capabilities. In other words, it can't pump if the tailwater has a stage lower than 20 feet, and it can't pump if the head differential exceeds 200 feet. Also, notice that the capacity of the pump is 3,000 cfs.
Remember that a tailwater definition needs to be added for a power plant and also for a pump. In this case, the tailwater is simply set to a constant elevation of 40 feet.
For the operational data at the main reservoir, I specify two rules in the conservation zone. The first rule is a power generation rule. I am using a plant factor of 100% for the entire conservation zone. This means that the entire generating capacity of the power plant is available anywhere in the conservation zone.
The next image shows the power generation pattern. I have power being generated for 0600 hours to 1000 hours and from 1400 hours to 1900 hours.
Recall that the intent of the example was to have power being generated during a morning and afternoon peak. The pumpback occurs in the overnight hours from 2300 hours to 0300 hours. In the rule shown below, I have specified that the full pump capacity be used, and that the source of the pumping is the pumpback reservoir.
I added one simple minimum release rule from the pumpback reservoir. This ensures that at least 10 cfs will be released.
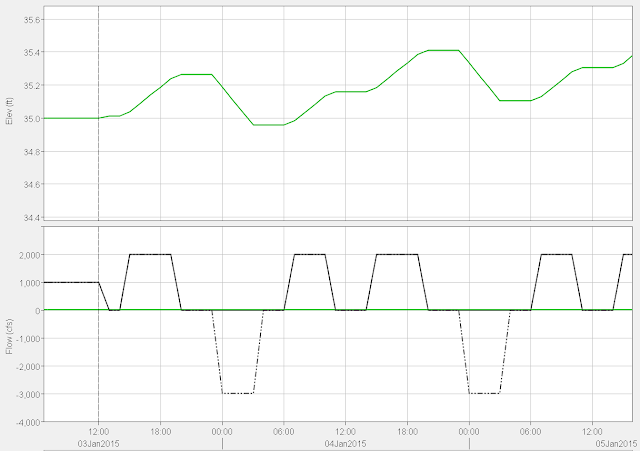
The image below is showing the pool elevation at the main reservoir in the top plot and the release and pumpback in the bottom plot. In the bottom plot, the green is showing the release from the power plant, and the red line is showing the pumpback into the main reservoir. Throughout this entire simulation, the pool is in conservation.
Notice that during times of power generation that the pool elevation is declining since the release exceeds the 1,000 cfs inflow. During times of no generation and no pumping, the pool is rising due to the inflow. During times of pumping the pool rises faster since there is the combined effect of the upstream inflow along with the pumping into the reservoir.
The next image shows the impacts at the downstream reservoir. The top plot shows the pool elevation. The bottom plot shows the inflow (dark solid line), the outflow (green line), and the net inflow (dark dashed line).
When the upstream reservoir is generating, the inflow into the downstream pool from this generation causes the pool to rise. When there is no generation and no pumping, the inflow into the pool is zero and the outflow is very small at 10 cfs. The pool is essentially flat during these times. When there is pumping from this reservoir, the net inflow goes negative and the pool elevation decreases.


congratulations!!! Thank you for this blog .... if you could make the simulation of operation of a reservoir but video will be more great ... I served much
ReplyDeleteCan you help me in finding out a solution to my problem? I want to apply the rule with my required 210 MW generation (that requires 390 m³/s release) only for 12 hours a day. For the rest hours of the day it can generate if there is extra flow above the conservation zone otherwise the generation should be zero and the remaining flow of the remaining 12 hours should be used ti fill up the reservoir so that it can release 390 m³7s for the 12 hours again next day (these are true generally when teh inflow is less and teh pool level is towrds bottom). But by using the power generation pattern (0 and 1 for the 12 hours) is not working--as the results shows it is nout using that remaining 12 hours to fill up the reservoir and during teh low flow period the pool remains always in the inactive level. What shall be done here?
ReplyDeleteI am not sure of why your particular model is not giving you the behavior that you are wanting, but I have a few thoughts. The generation pattern should cause ResSim to generate at the hours that you specify. If you are in the conservation pool, ResSim will not release unless you have a minimum release rule or the power generation rule. If you are in the flood pool, ResSim will release as much as possible unless limited by a maximum release rule. So, the internal logic of ResSim along with your power generation rule should be covering your operations.
DeleteBy the way, I am using the inflow in daily time step, is that a problem here to consider only 12 hours generation but providing inflow as daily time step?
ReplyDeleteResSim should be able to handle that, but I normally put my DSS data into the time step that I want the model to run on. Once I have some time, I will make some posts dealing with the time step issue and the power generation issue that you detailed above.
DeleteThanks for sharing this !
ReplyDelete